
Last week, I shared that Dan Katz and I had finally published a draft of our paper, Measuring the Complexity of the Law: The U.S. Code. Since then, we've received great feedback and a number of questions.
The most common question, even among legal professionals, is exactly what you'd guess — is the Tax Code (i.e., Title 26, I.R.C.) the longest Title? The answer, in our opinion, is also what you might guess — it depends. But first, let's look at a few measures of Titles in the Code.
These plots are all based on data from our Github repository and the source to reproduce them can be found in the accompanying R and ggplot2 gist.
# @date 20130818
# @author Bommarito Consulting, LLC; michael@bommaritollc.com
# @page http://bommaritollc.com/?p=1067
# Load libraries
library(ggplot2)
# Load data from git master
title_data <- read.csv('https://raw.github.com/mjbommar/us-code-complexity/master/results/table_data.csv',
header=T,
colClasses=c('factor', rep('numeric', 14)))
names(title_data)[2:5] <- c('ElementCount', 'SuperSectionCount', 'SectionCount', 'SubSectionCount')
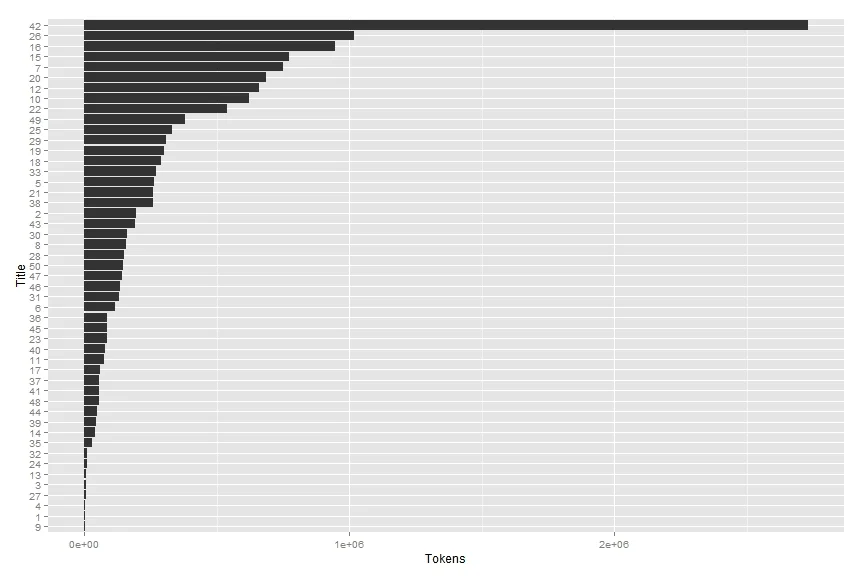
# Plot descending word count
token_title_data <- title_data[order(-title_data$Tokens), c('Title', 'Tokens')]
token_title_data$TitleN <- reorder(token_title_data$Title, token_title_data$Tokens)
ggplot(token_title_data, aes(x=TitleN, y=Tokens)) +
geom_bar(stat="identity") +
scale_y_continuous("Tokens") +
scale_x_discrete("Title") +
coord_flip()
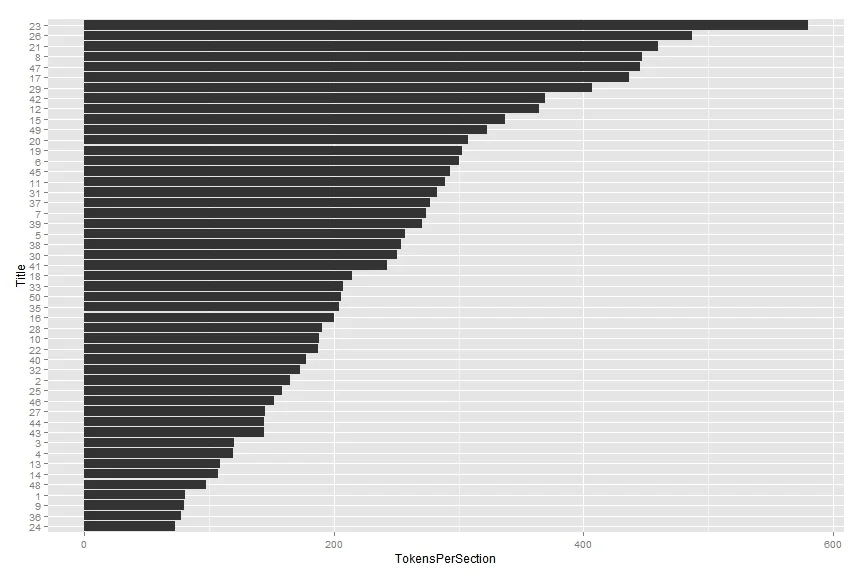
# Plot descending words per section count
tps_title_data <- title_data[order(-title_data$SectionCount), c('Title', 'TokensPerSection')]
tps_title_data$TitleN <- reorder(tps_title_data$Title, tps_title_data$TokensPerSection)
ggplot(tps_title_data, aes(x=TitleN, y=TokensPerSection)) +
geom_bar(stat="identity") +
scale_y_continuous("TokensPerSection") +
scale_x_discrete("Title") +
coord_flip()
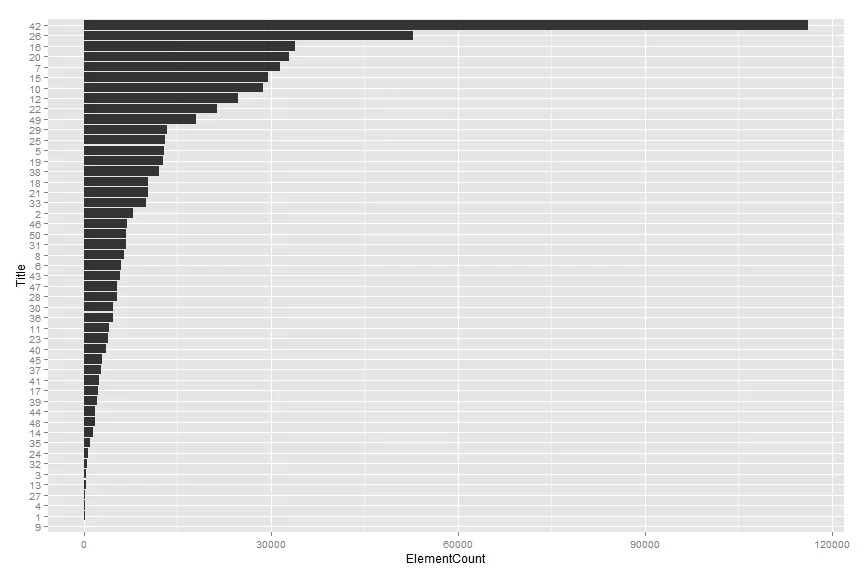
# Plot descending element count
element_title_data <- title_data[order(-title_data$ElementCount), c('Title', 'ElementCount')]
element_title_data$TitleN <- reorder(element_title_data$Title, element_title_data$ElementCount)
ggplot(element_title_data, aes(x=TitleN, y=ElementCount)) +
geom_bar(stat="identity") +
scale_y_continuous("ElementCount") +
scale_x_discrete("Title") +
coord_flip()
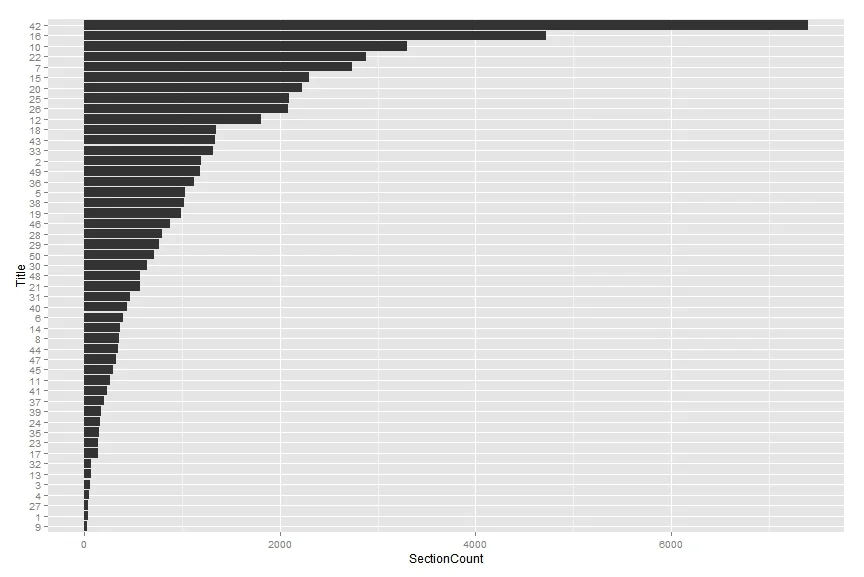
# Plot descending section count
element_title_data <- title_data[order(-title_data$SectionCount), c('Title', 'SectionCount')]
element_title_data$TitleN <- reorder(element_title_data$Title, element_title_data$SectionCount)
ggplot(element_title_data, aes(x=TitleN, y=SectionCount)) +
geom_bar(stat="identity") +
scale_y_continuous("SectionCount") +
scale_x_discrete("Title") +
coord_flip()What do we notice? Title 26 is not the longest or biggest by any measure. It doesn't have the most words (Title 42), the most elements/sections (again, Title 42), or even the most words per section (Title 23). So what can we say?
Are Titles the right unit of measure? Titles are the first cut of the hierarchical categorization of the U.S. Code. It is generally accepted that they do not always represent a cohesive body of law; for example, Title 42 — Public Health and Welfare, is an amalgamation of topics as diverse as commercial space transportation, farm housing, and healthcare. However, with Acts, they are the most commonly discussed group.
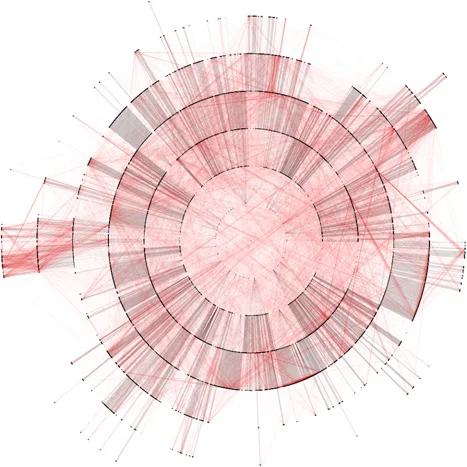
Is any division of the Code atomic? If you've read any statutory text, you are familiar with references or citations that incorporate definitions, rules, or other language. If Title 26 and Title 42 are heavily interdependent through reference, does it make sense to compare them? We believe the only proper way to do this is by incorporating measures of the network structure of the Code.
Hopefully, this discussion has piqued your interest in measuring legal complexity and raised your awareness around some common pitfalls. If so, please give our paper a read and let us know what you think!