
Much of this morning went into investigating strange ADDM reports on a two-node Oracle RAC database. For some reason, there were statistically improbable differences between impact percentages that have persisted over a month; in this case, instance 2 would consistently have wildly higher impacts for some optimizer-related activities. For example:
Finding 3: Hard Parse
Impact is .09 active sessions, 15.46% of total activity.
--------------------------------------------------------
Hard parsing of SQL statements was consuming significant database time in some
instances.

Instances that were significantly affected by this finding:
Number Name Percent Impact ADDM Task Name
------ ------- -------------- --------------
2 RAC2 70.16 Report 20121009D$2
1 RAC1 29.84 Report 20121009D$1
My first line of research was to review connection strings on the custom applications and reporting tools that have been put in place. I assumed that someone had skipped the SCAN address or specified a DSN with SID, not service name. There must have been some reporting SQL that changed or was poorly auto-generated, causing the optimizer load to differ. However, this investigation led to no results.
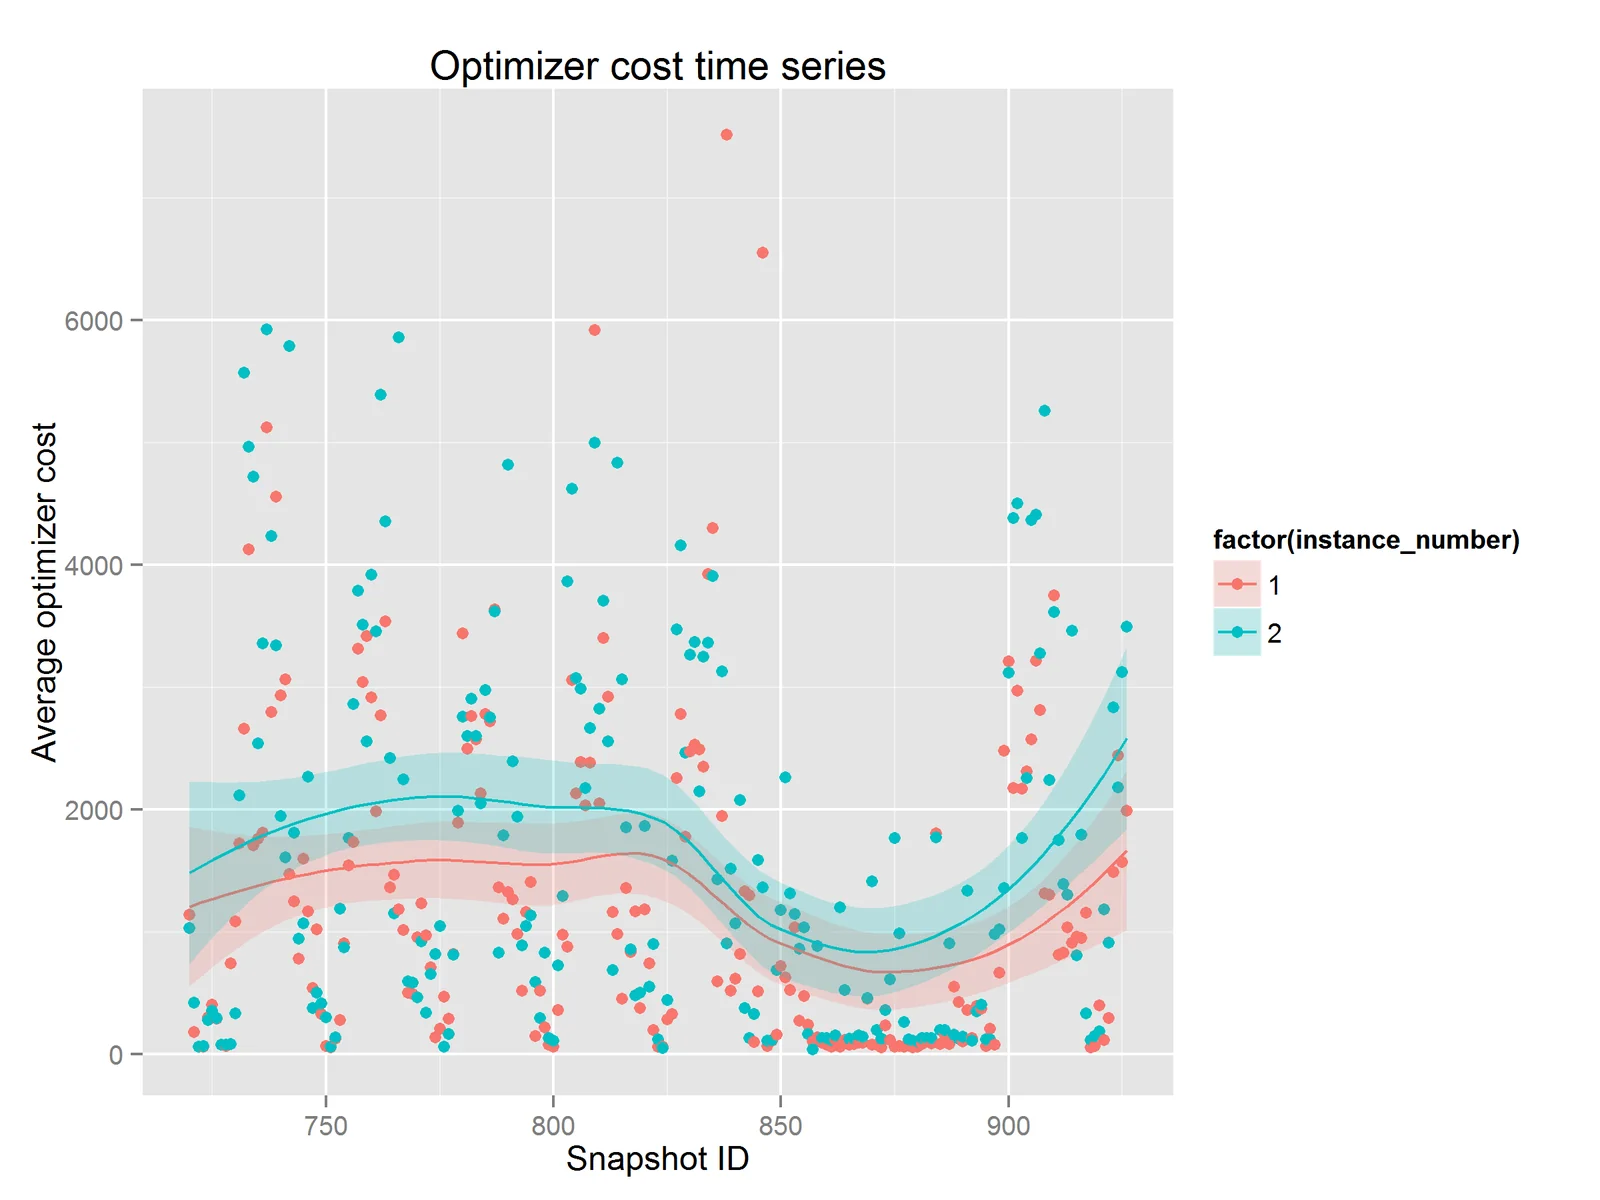
Next, I tried to trace the issue back through the basics. The differences were primarily in optimizer activity, so I wanted to look at a time series plot of optimizer_cost in dba_hist_sqlstat by instance.
SELECT dhss.instance_number as instance_number,
    dhss.snap_id as snap_id,
    AVG(dhss.optimizer_cost) as average_cost,
    SQRT(VARIANCE(dhss.optimizer_cost)) as stddev_cost
  FROM dba_hist_sqlstat dhss
  GROUP BY dhss.instance_number, dhss.snap_id
  ORDER BY dhss.snap_id, dhss.instance_number;
This got some pretty strange results. I plotted the output in R with ggplot using the lines below.
ggplot(data) +
  geom_point(aes(x=snap_id, y=average_cost, color=factor(instance_number))) +
  geom_smooth(aes(x=snap_id, y=average_cost, color=factor(instance_number), fill=factor(instance_number)), alpha=0.2) +
  theme_grey() +
  scale_x_continuous("Snapshot ID") +
  scale_y_continuous("Average optimizer cost") +
  ggtitle("Optimizer cost time series")
Instance two has had strictly higher loess-smoothed average optimizer costs, even during snapshots in which the average cost was nearly zero. It's almost like they were using entirely different optimizers. Then it hit me - what if some parameters that affected the optimizer were not synchronized between the databases? How could I quickly check?
SELECT p1.name, p1.value, p2.value FROM gv$parameter p1
  JOIN gv$parameter p2 ON p1.name = p2.name
  WHERE p1.inst_id = 1
    AND p2.inst_id = 2
    AND p1.value != p2.value
    AND p1.name NOT IN ('instance_number', 'instance_name', 'local_listener');
Lo and behold, optimizer_mode, optimizer_index_cost_adj, optimizer_index_caching, and workarea_size_policy differed between instance 1 and instance 2. Time to get this fix in to change control review and help get this system back up to full steam.