
Throughput, throughput, throughput - for many databases, this is the performance measure of importance. When you are working with a fixed number of IOPS but see mixed workload types, system health can be assessed through the average read and write operation size. In an ASM environment, we can query this information by ASM disk from gv$asm_disk_stat (docs.oracle.com/cd/B19306_01/server.102/b14237/dynviews_1...)as follows:
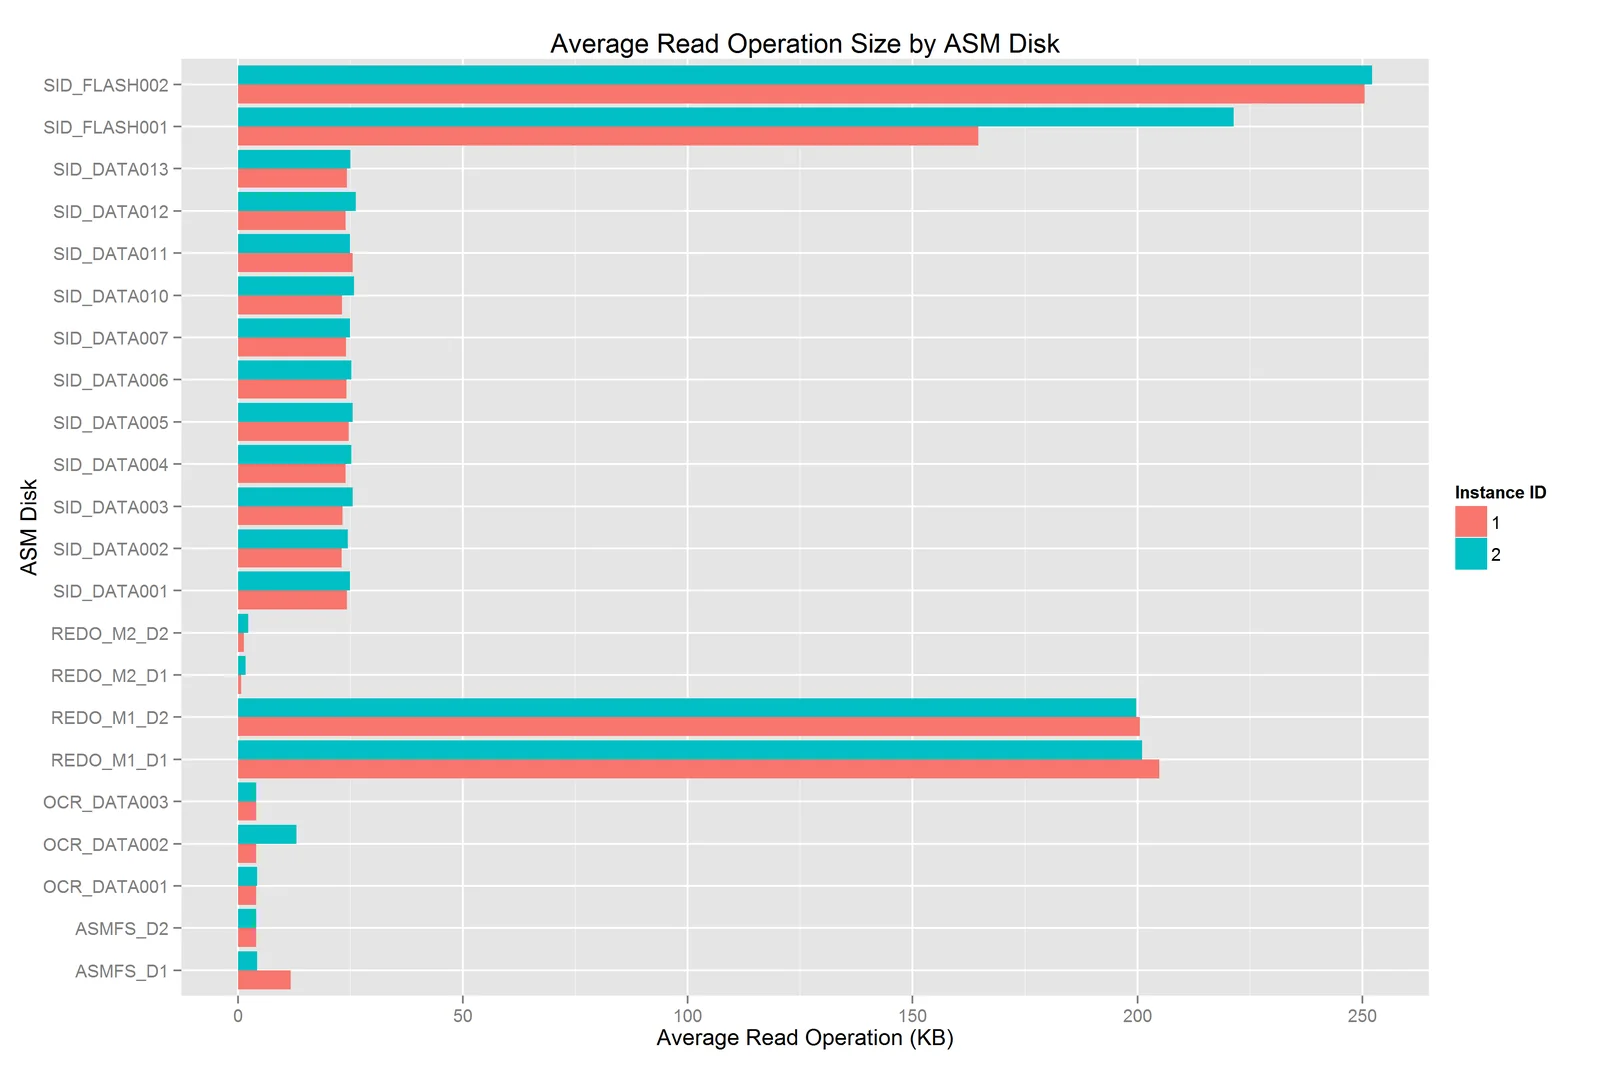
While the output of this query is nice, it would be much nicer to consume visually. Furthermore, while similar plots are available in OEM or 12c, many organizations have chosen not to implement these options. Combining R, ggplot2 (ggplot2.tidyverse.org/), and my tutorial on connecting RJDBC to Oracle (bommaritollc.com/insights/connecting-r-oracle-rjdbc/), we can summarize information like this using a low-cost query and no additional hardware or software.
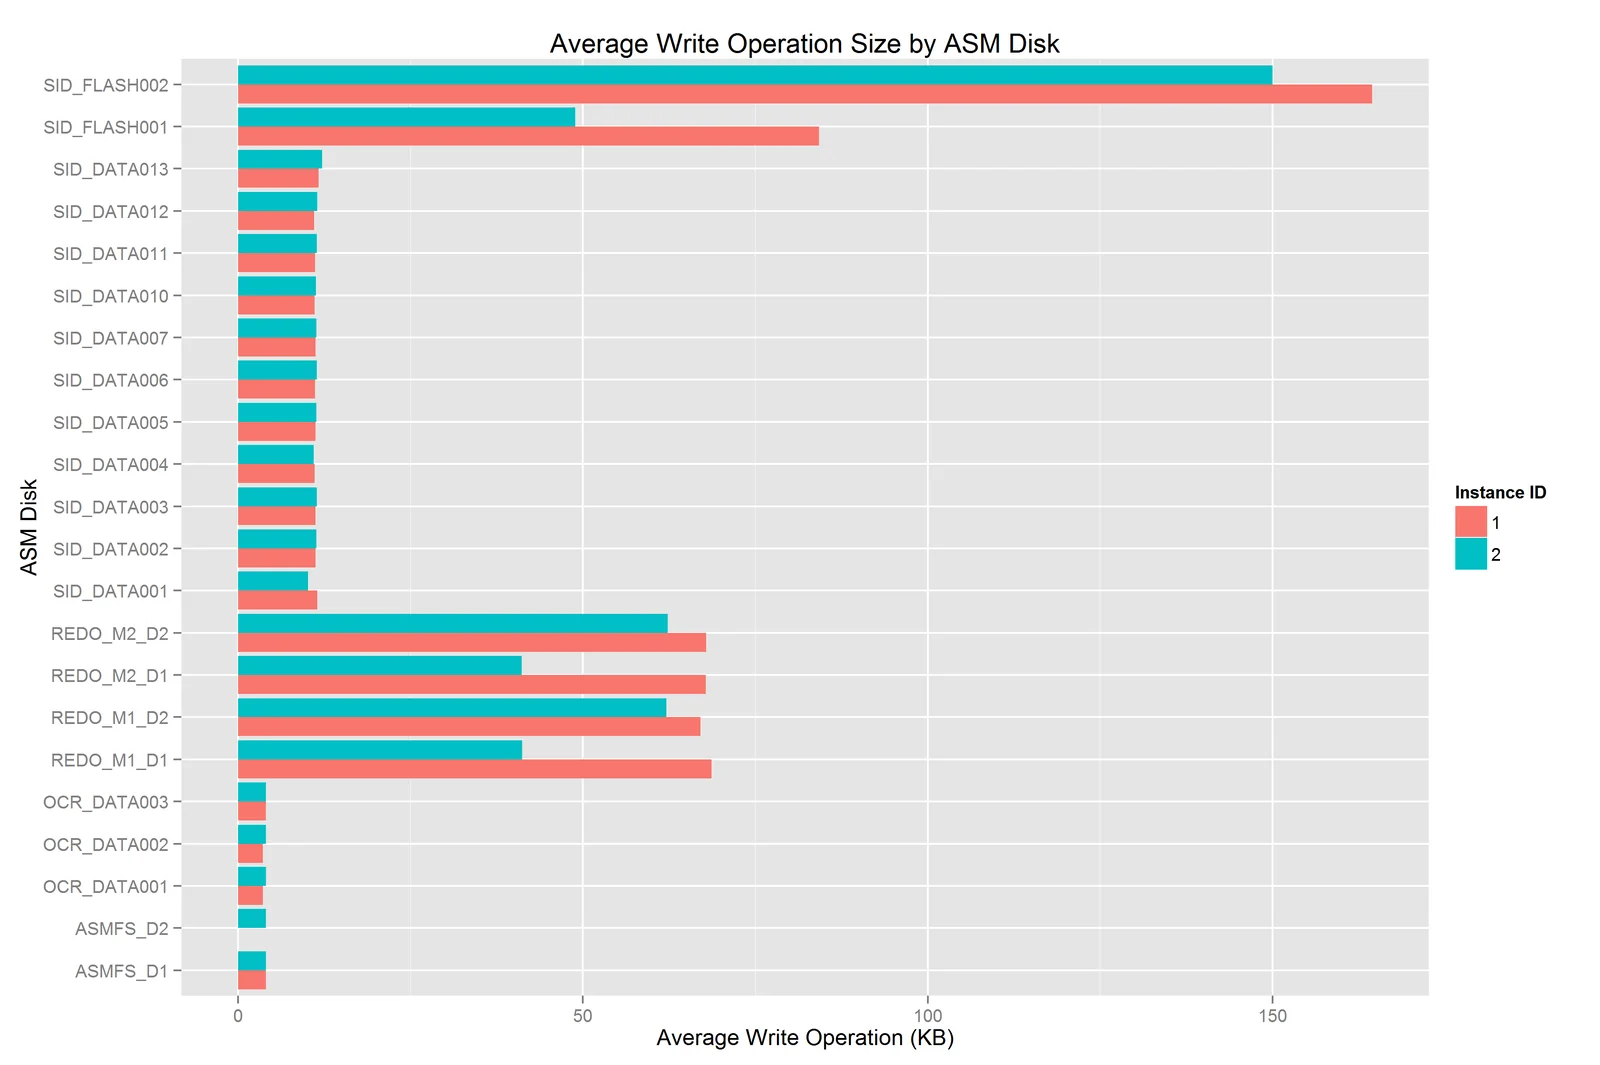
If you're interested in replicating this plot, you can find the gist to plot average read and write operation size here (gist.github.com/mjbommar/5765497).
Interested in custom reporting or analysis on your databases' data or performance? Please don't hesitate to reach out (mailto:inquiry@bommaritollc.com?subject=Custom+Oracle+Reporting).